
Overview
In this post I’ll show a few techniques I used to test performance of Essbase Drill Through Reports. I personally found those techniques useful, but i’m not saying there’s no better way to achieve the same. Also keep in mind, those techniques do not cover the following areas:
- Any concurrent testing, although it can be built on top this framework.
- Client-side testing, such as time required to bring query results back to Excel, and render it.
Keeping all that in mind let’s start.
Assume you have an approximate idea how your users are going to use drill-through reports. For example, you have a number of test cases, or user behavioral patterns. One of those patterns can be described as this:
Expense analyst drills from
- Children of Direct Expenses account
- One of the VP nodes of CostCenter hierarchy
- All business Units
- All Entities
- level 0 of TimePeriod Years, Currency, Version, Scenario hierarchies.
Let’s assume there are 13 children of Direct Expense, and 9 VP nodes, hence this scenario can generate 117 queries for a single combination of month/year/currency/version/scenario.
When we run drill-through report from one of those 117 intersections, the Essbase Studio (or other tool that enables drill though) will generate lists of level 0 members for each dimension. Those lists will be used in “where” conditions of the drill through query.
Obviously, each of those intersections will generate completely different lists of level 0 members, hence different SQL statements against your source.
For example, VP_RootBeer may have just 3 level 0 cost centers, whereas VP_JustNormalBeer will have 34 cost centers, or vice versa.
A different drill through pattern may generate thousands of possible queries, and we need to know how execution time and data volumes are distributed (their histograms).
In other words we need to be able to say something like this: this particular drill-through pattern generates 2,567 possible queries, of which 1,876 return non-empty data set. 95% of those queries complete in 7 seconds, and return a maximum of 16,000 records. 1% of the queries take longer than 140 seconds, and return more than 350,000 rows.
Why would we need this information?
- We need to know what load this drill-through pattern generates on the source system. This is especially important if the source system is a live application like EBS or other system of record.
- We need to know what percentage of the users will experience normal performance, and who will need to be educated to drill down into lower levels of the hierarchy within essbase cube, before drilling through to relational source.
- Although we are not talking about concurrency here, statistics above will help us define concurrency tests.
- They will help us to allocate resources on the source system and to optimize queries.
- This will help us to prioritize development effort, and not to spend disproportionately trying to optimize queries for a fraction of users. Maybe drilling into a huge number of transactional level details doesn’t help them with their business process in the first place.
Pattern Definition
In order to get drill-through performance histograms we need to run all possible drill-through reports for a specified drill-through pattern, and register execution time and number of returned records. One possible way to approach this is to generate and execute dynamic SQL statements for every drillable cell, with stored procedure and cursors.
Let’s assume we have Account hierarchy like this:
Account
--OperatingIncome
--DirectExpense
--WorkforceCost
--WorkforceCompensation
--Recruiting
--TravelAndEnt
--Travel
--MealsAndEntertainment
--SomeAccount3
--SomeAccount2
--SomeAccount 1
|
First we need to define a drill-through pattern. For each dimension we’ll specify:
- A member relative to which users will be allowed to run drill-through reports. For example “Account”, or “DirectExpense”
- Generation relative to specified member. A separate drill-through query will be generated for each member’s relative from specified generation. For example, if we specified “DirectExpense” in a previous step, and generation 2 in this step, drill through queries will be generated for WorkforceCompensation, Recruiting, Travel, MealsAndEntertainment (those members are generation 2 relative to DirectExpense, whereas DirectExpense is generation 0). [Note: There’s a discrepancy between how Essbase counts generations - starting with 2 for the first child, and Oracle hierarchical queries count levels - 1 for the first child].
If we wanted to limit drill-through pattern only for WorkforceCompensation and Recruiting, we could select WorkforceCost and generation 1.
- We also need an option to specify all level 0 descendants of the specified member. For example, if we specify level 0 members of TravelAndEnt, drill-through queries will be generated for Travel, MealsAndEntertainment.
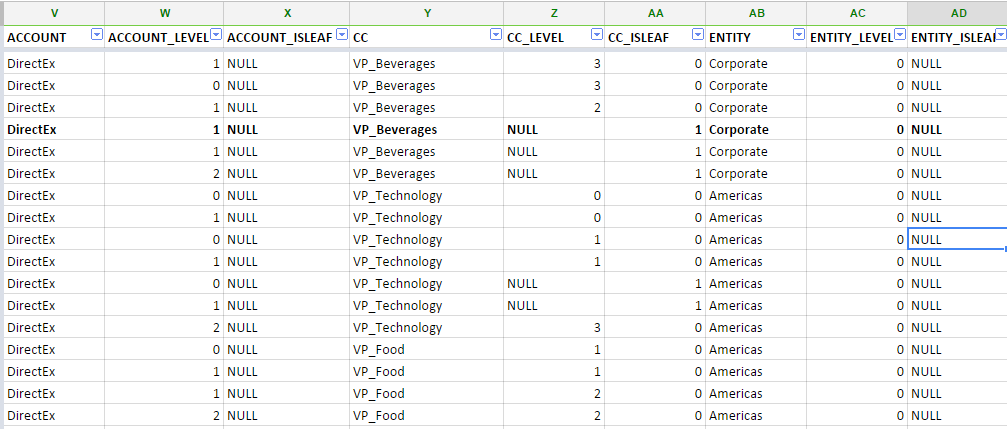
Below is an example of stored procedure call. It uses 3 dimensions for which drill through pattern is defined. If needed, it could be more than just 3 dimensions.
DECLARE
TESTCASE_DIM1 VARCHAR2(200);
TESTCASE_DIM1_LEVEL NUMBER;
TESTCASE_DIM1_ISLEAF NUMBER;
TESTCASE_DIM2 VARCHAR2(200);
TESTCASE_DIM2_LEVEL NUMBER;
TESTCASE_DIM2_ISLEAF NUMBER;
TESTCASE_DIM3 VARCHAR2(200);
TESTCASE_DIM3_LEVEL NUMBER;
TESTCASE_DIM3_ISLEAF NUMBER;
...
VAR_TESTCASEDESC VARCHAR2(200);
BEGIN
VAR_TESTCASEDESC := 'TC2_ExpenseAnalyst. Medium1.';
TESTCASE_DIM1 := 'DirectEx';
TESTCASE_DIM1_LEVEL := 1;
TESTCASE_DIM1_ISLEAF := NULL;
TESTCASE_DIM2 := 'VP_Beverages';
TESTCASE_DIM2_LEVEL := 3;
TESTCASE_DIM2_ISLEAF := 0;
TESTCASE_DIM3 := 'Corporate';
TESTCASE_DIM3_LEVEL := 0;
TESTCASE_DIM3_ISLEAF := NULL;
....
DTRSTATS(
TESTCASE_DIM1 => TESTCASE_DIM1,
TESTCASE_DIM1_LEVEL => TESTCASE_DIM1_LEVEL,
TESTCASE_DIM1_ISLEAF => TESTCASE_DIM1_ISLEAF,
TESTCASE_DIM2 => TESTCASE_DIM2,
TESTCASE_DIM2_LEVEL => TESTCASE_DIM2_LEVEL,
TESTCASE_DIM2_ISLEAF => TESTCASE_DIM2_ISLEAF,
TESTCASE_DIM3 => TESTCASE_DIM3,
TESTCASE_DIM3_LEVEL => TESTCASE_DIM3_LEVEL,
TESTCASE_DIM3_ISLEAF => TESTCASE_DIM3_ISLEAF,
...
VAR_TESTCASEDESC => VAR_TESTCASEDESC
);
--rollback;
END;
/
|
Query Level 0 Members Dynamically
If we use Essbase studio, our drill-through report query will look something like this:
select col1, col2, ...
from
table1, table2,...
where 1=1
and table1.cola=tablen.colx
...
AND (ACCOUNT IN ( $$Account-VALUE$$))
AND (COSTCENTER IN ( $$CostCenter-VALUE$$))
...
|
The filter conditions in bold are replaced by the tool you are using for drill-through. In case of Essbase studio it replaces a token inside $$ signs with level 0 members from your dimension.
Since our procedure defines drill-through queries dynamically, we need a way to generate level 0 members for current drill-through intersection. An easy way to do that is to use Oracle hierarchical query. An example of such a query would be:
select col1, col2, ...
from
table1, table2,...
where 1=1
and table1.cola=tablen.colx
...
AND (UPPER(ACCOUNT) IN (
SELECT UPPER(CHILD) FROM
(SELECT PARENT, CHILD, CONNECT_BY_ISLEAF ISLEAF FROM V_YOURAPP_ACCOUNT
CONNECT BY PRIOR CHILD= PARENT
START WITH upper(CHILD) = upper(DIM1_CHILD))
WHERE ISLEAF = 1
))
AND (UPPER(COSTCENTER) IN (
SELECT UPPER(CHILD) FROM
(SELECT PARENT, CHILD, CONNECT_BY_ISLEAF ISLEAF FROM V_YOURAPP_COSTCENTER
CONNECT BY PRIOR CHILD= PARENT
START WITH upper(CHILD) = upper(DIM2_CHILD))
WHERE ISLEAF = 1
))
...
|
Here the lists of level 0 members is generated dynamically based on the value of DIM1_CHILD and DIM2_CHILD. Those are the variables used in stored procedure and getting its values from the cursors, which query dimension views based on drill-through pattern specification.
Note the source of level 0 members: V_YOURAPP_ACCOUNT and V_YOURAPP_COSTCENTER. Those are the same views used to create dimension hierarchies.
Reviewing Results
So, you defined multiple drill-through patterns for different user groups, and executed procedures that ran all possible drill-through queries for the defined patterns. Below is the report for a single testing pass:
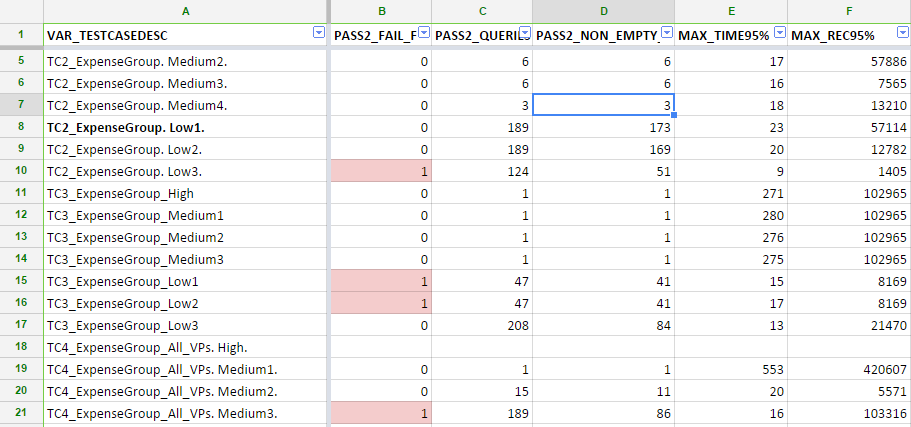
Here each row
- Defines a drill-through pattern
- Provides indication whether the test case completed successfully or one of the drill-through queries returned an error.
- Total number of queries executed
- Number of non-empty queries
- Maximum execution time in the 95th percentile.
- Maximum number of rows in the 95th percentile.
Since every dynamic query is logged in a table, i can review and rerun those queries that have failed and make necessary changes to SQL.
Multiple Passes
We may want to rerun multiple passes of those tests as we develop drill-through queries, or as we change the load on the source system from other applications, integration jobs, etc. In the end we can compare drill through performance of multiple passes. The graph below shows maximum execution time in the 95th percentile by drill through pattern.

The chart below shows minimum records per second rate:

Also, i would want to validate, that when i run drill-through reports from Smartview, performance correlates with automatic queries. Timing will be definitely different - it will take extra time to bring back the result set from relational database to Smartview, and render the results. Network latency will have an impact, and again - we didn’t test for concurrency here.
If i wanted to manually validate the queries i would probably choose those queries, that take longest, and bring back the largest number of records in the 95th percentile (or whatever percentile you think is appropriate for your business case). So i would get a text of the query that generated that result, update my Smartview with member values from the query, and run that drill-through report.
No comments:
Post a Comment